Newspapers often enough publish graphs which give wrong impressions on what the numbers behind the diagram actually mean. The usual culprit is a y-axis which does not start with 0, thus visually inflating any trend/changes in the data.
This week I stumbled upon something else:
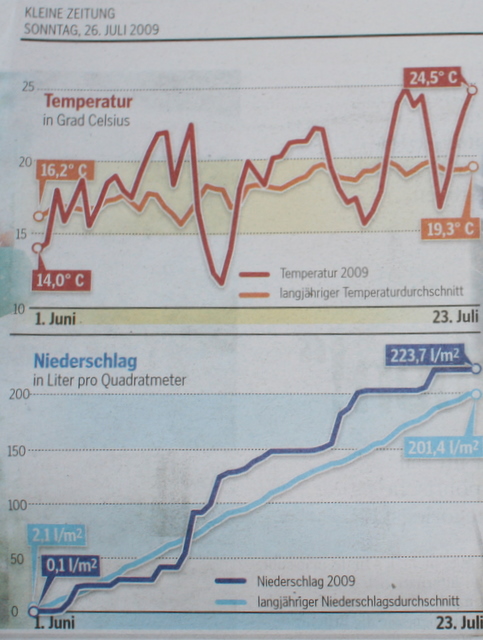
The article was all about “Do we have to expect more extreme weather in the future thanks to global warming?”. The expert they interviewed kind of rejected the premise that we can deduce anything from one year’s weather. But they wanted to have a scary graph in the article, so they came up with this one.
So what’s wrong? If you compare the temperature and precipitation graphs of one year with the long-term averages, then it’s almost a given that the current year will look more extreme than the averages.
The comparison might make sense if you argue that 2009 is colder/warmer/wetter/dryer than the average year, but for comparing weather variance, this is completely worthless.